Published in Molecular Neuropsychiatry. Our clinical tests and initial clinical trial were based
on original work and were published in Molecular Neuropsychiatry in 2018. – Vawter MP, Philibert R,
Rollins B, Ruppel PL, Osborn TW. Exon Array Biomarkers for the Differential Diagnosis of Schizophrenia
and Bipolar Disorder. Mol Neuropsychiatry. 2018;3(4):197-213. © 2018 S. Karger AG, Basel
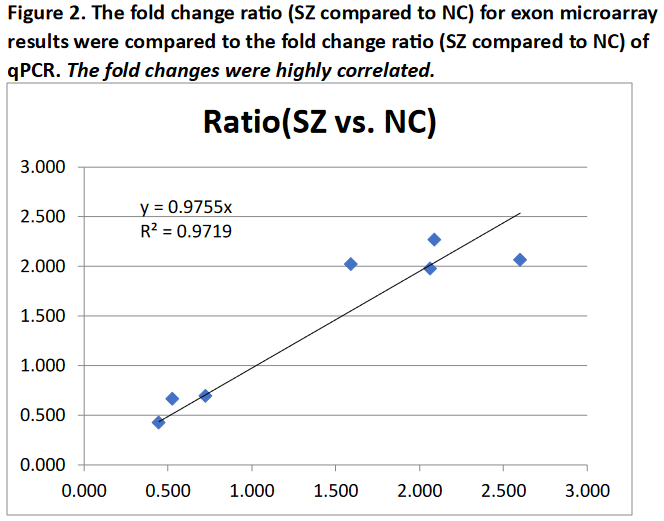 Transcripts were selected for quantitative PCR (qPCR) validation based upon significant differences using
the ANOVA filter. We selected transcripts that represented a combination of the most significant ANOVA p
values for SZ compared to NC and repre- sented fold changes greater than 1.25. See Figure 2.
Transcripts were selected for quantitative PCR (qPCR) validation based upon significant differences using
the ANOVA filter. We selected transcripts that represented a combination of the most significant ANOVA p
values for SZ compared to NC and repre- sented fold changes greater than 1.25. See Figure 2.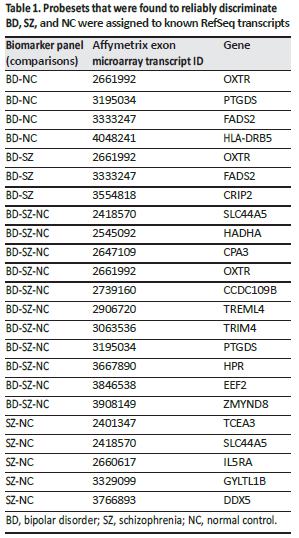
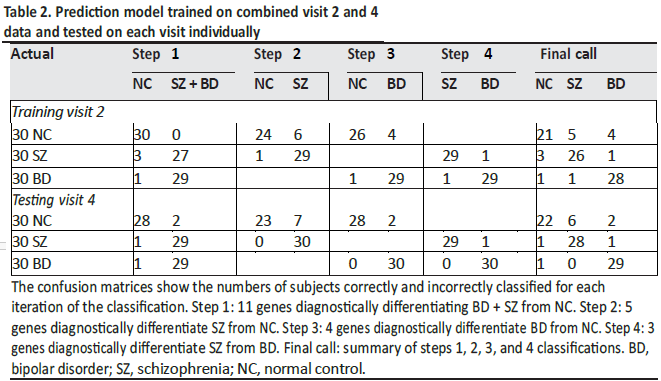
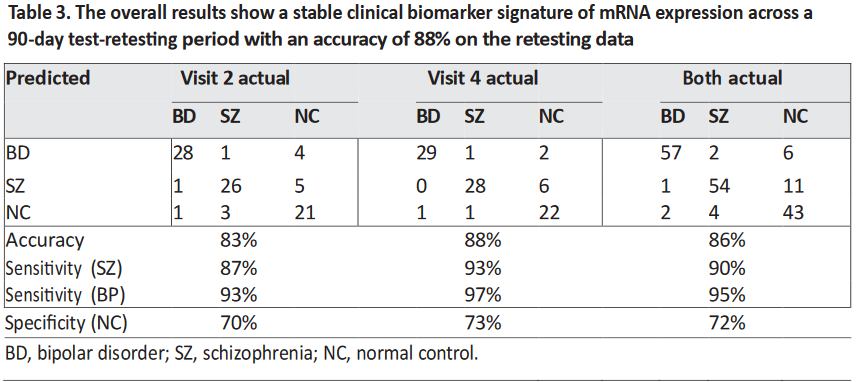
The 18-gene biomarker panels, using logistic regression modeling, correctly differentiated the three
groups of subjects (SZ, BD type I, and NC) with high accuracy at visit 2 and visit 4. The visit 2 cut-point
probabilities for the SZ-NC comparison were significantly correlated with the visit 4 cut-point probabilities
(p < 0.0001) with r = 0.74 (95% CI 0.59–0.83) showing temporal stability (Table 3).
The initial model was developed to select stable probesets across visits, and all subjects and visits
were incorporated to select the most informative probesets. To test that no single subject was overly
influential in determining the model, the initial probesets were evaluated by a “leave-one-out” method,
whereby a new model is fit to the re-maining subjects, and the left-out subject is identified. “Leave-one-out”
cross-validation is a model validation technique for assessing how the results of a statistical analysis
will generalize to an independent data set. It is mainly used in settings where the goal is prediction to
estimate how accurately a predictive model will perform in practice.
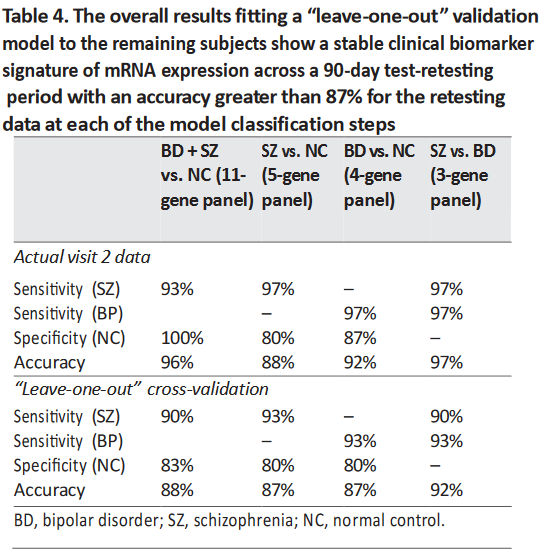 This cross-validation was applied to the visit 2 data from each of the four probeset panels (Table 4). The results
are very consistent with the actual data, and the “leave-one-out” analyses indicate that the models should be
predictive when applied to independent data cohorts.
This cross-validation was applied to the visit 2 data from each of the four probeset panels (Table 4). The results
are very consistent with the actual data, and the “leave-one-out” analyses indicate that the models should be
predictive when applied to independent data cohorts.
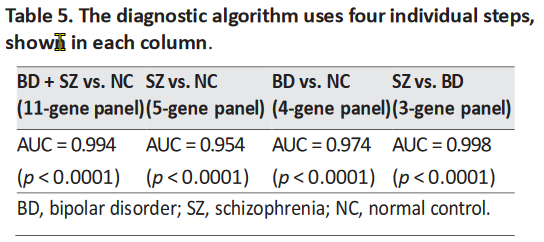 The AUC for each step was greater than 0.95, indicating the high combined sensitivity and specificity
of the classification into three groups (Table 5). The data were not normalized to blood counts (CBC
measurements) for our main data analysis reported in this paper.
The AUC for each step was greater than 0.95, indicating the high combined sensitivity and specificity
of the classification into three groups (Table 5). The data were not normalized to blood counts (CBC
measurements) for our main data analysis reported in this paper.Discussion
To determine stable temporal biomarkers, this study evaluated whole blood gene expression at two
different time points using the same subjects (SZ, BD, and NC) for differential diagnosis. The
diagnostic algorithm used logistic regression modeling and a total of 18 uniquely expressed exons
within known mRNA transcripts. The model discriminated SZ and BD from each other, as well as both
from healthy controls in four steps. The upper limit of accuracy achieved in this biomarker study
was 88%, using an independent visit of the same patients. When using the “leave-one-out” evaluation
algorithm, the results were very consistent with the actual data; thus, the “leave-one-out” analyses
indicated that the models were not driven by outliers and that they should be predictive when applied
to independent data cohorts.
It is expected that the application of these panels to first-episode or prodromal subjects may improve prediction for those subjects that ultimately convert to either illness, as well as for the millions of patients worldwide that have not received any clear diagnosis of their ongoing disorder. This will require an additional validation study of the biomarker signatures with a larger cohort in a follow-on project.
The differences in expression of 3 genes (PTGDS, FADS2, and HADHA) related to polyunsaturated fatty acid (PUFA) and prostaglandin biosynthesis were used for the final biomarker panels to differentiate between SZ, BD, and NC. Previously, these genes have been associated with psychiatric disorders such as BD, major affective disorder, SZ, and anxiety. PTGDS is involved in the synthesis of PGD2 from PGH2, the cyclooxygenase-mediated product of arachidonic acid which is a PUFA [4]. PTGDS is a top anxiety gene modulated by changes in PUFA (omega-3 fatty acid docosahexaenoic acid) [73] on the convergent functional genomics scale. Increased expression of FADS2 has been found in SZ and BD brains post mortem [74, 75]. FADS2 activity is increased in BD and is associated with suicidal behavior [76].
In the present study, we found an increased expression of FADS2 in BD, in agreement with the FADS2 findings reported. The increased activity of FADS2 could reduce PUFA levels of both arachidonic acid and eicosapentaenoic acid by promoting conversion to longer-chain fatty acids, shown in both the n–3 and the n–6 pathway (Fig. 5 - See complete article). Thus, PUFA supplementation with n–3 fatty acids in mood disorder was effective in reducing mood symptoms in 4 out of 7 well-controlled studies [76]. The expression data for FADS2, while interesting, could be subject to dietary influence, such as amounts and types of daily dietary intake of fatty acids, the timing of intake, and also medication effects on these genes. Further, genetics plays a significant role, especially in modulating levels of fatty acids and FADS2 expression. Another limitation to the assessment of these genes as representing actual pathophysiological markers is that, potentially, stress could modulate the biomarker panel genes. Many patients with BD and SZ experience higher levels of stress than controls, which might explain differences in immune cell activation and prostaglandin synthesis. We examined our biomarker panel of 18 genes in our unpublished stress data set (M. Martin and MPV) using the same exon array approach and Tempus tube approach on healthy volunteers who underwent sleep deprivation and 9 repeated blood draws over 54 h, i.e., every 6 h. We checked our results for the healthy controls and found that 4 transcripts that passed Bonferroni corrections were affected by time of day and, potentially, stress induction as well (DDX5, EEF2, HADHA, and CCDC109B). However, these 4 genes did not vary in the present study, even though in the stress data set these genes varied by time of day. Taken together, although these 4 genes were dysregulated as a consequence of time of day and sleep deprivation, these genes in the present study were stable across 8 weeks of time, and would have been expected to show some fluctuation with stress levels or time of day.
Over 100,000 adolescent Americans suffer from symptoms of psychosis each year, as well as millions of patients worldwide that have not received any clear differential diagnosis of their ongoing disorder; yet, currently, there are no biomarker tests that are FDA approved to classify SZ or BD. There is a serious need for “objective” clinical laboratory tests for an early diagnosis of these mental disorders, since today these disorders may typically take months or even years to reach a diagnosis and for patients to receive effective treatment. The lag in treatment is as-sociated with an increase in suicide rates and recurrent episodes of psychosis and mood dysregulation. There is a large increase in deaths reported among first-episode psychotic subjects due to lack of treatment after the first year of illness [1]. Thus, it is important to have objective biomarkers to help implement treatment at an early stage. One estimate of the direct and indirect annual costs in the USA for SZ is USD 174 billion [88], with an additional cost of USD 151 billion for BD [89]. Biomarker signatures could lead to faster and more accurate diagnoses, reducing the duration of untreated psychosis, suicidality, and cognitive decline and adding to an understanding of the shared and unique pathophysiologies of each disorder. The blood test results that are described in this paper, if further validated in a larger number of subjects, will offer molecular diagnostic support for psychiatrists’ clinical evaluation with rapid clinical laboratory test results.
Disclosure Statement
A SBIR Phase I project “Gene expression exon array biomarkers to diagnose schizophrenia” (R43 MH090806) was
awarded (TWO) for developing a blood-based commercial biomarker
for psychiatric disorders. The authors (MPV
and TWO) are officers of Laguna Diagnostic, LLC, and
co-inventors of a US patent to commercialize the results presented.
References (See Complete Article)